Search Results
Search this site
2352 results found with an empty search
- January 17, 2023 S&P 500 Predictions (RATED)
*Accuracy rating update: 93% or 13/14 predictions correct* Day’s Theme: A bullish move that offers an opportunity to open up a short position. Behavior Around the High: A crest that we’ll sell down from to and through a support level. This is followed by a U-shaped reversal below that support level where we’ll move back up to reuse it as support. Behavior Around the Low: A male ruler of nations is highlighted around the low. There’s also a key support level highlighted, however it’s somehow nullified. Trade Opportunities: A rally around the open marks an opportunity to open up a short position. That short position can be closed in the midst of a decline late morning or early afternoon. I’m advised to trade around a decline that offers an opportunity to open up a long position. Overview On January 17th, we’ll attempt to reestablish support in the pre-market. There’s some sideways rotation around the open followed by a fast, sudden move higher that marks the end of that sideways rotation. That rally out of the open offers an opportunity to open up a short position. We’ll decline from that rally to and through a support level and then move back up to reuse that support level as support. The previously opened short position can be closed in the midst of a decline in the first hour and a half, and there’s another trade opportunity to open up a long position in the midst of the same decline. Between roughly 11:00 a.m. and noon, we’ll see a sideways S-formation within a channel. Midday, we have a price level highlighted that’s a good point for a straddle/strangle utilizing options strategies. There’s a higher high than we had in the morning between roughly noon and 2:00 p.m. From that high, we decline to and through a support level and then move back up through that support level in a U-shaped reversal. In the last two hours, there’s a brief high that could be easily missed followed by a significant decline. There’s a move to the upside in the post-market and a resistance level highlighted. Sneak Preview A failed attempt to break through key resistance on the 18th. #0TheFool #PrincessofCups #4ofCups #10ofCups #4ofDisks #AceofWands #4ofSwords #QueenofCups #PrincessofSwords #IITheUniverse #7ofDisks #8ofCups #ITheMagus #KnightofDisks #IVTheEmperor #8ofSwords
- February 2023 Ocean Protocol (OCEAN) Predictions (Public Version)
Month’s Theme: A breakout out of a prominent trough or low on the scale of a one-month chart. In the second half of the month, we’ll have sideways rotation at a new, higher support level. Behavior Around the High: Erratic behavior back and forth through the same price level. In the midst of that erratic behavior, we’ll revisit a crest that was recently a past opportunity. Behavior Around the Low: A big, almost irrational move out of the low to reach for distant resistance. Overview Week One (2/1-2/4) On February 1st, we’ll decline into a lowest low and there’s a notable rally out of that low that stands out on a multi-day chart. On the 2nd, there’s a sideways S-formation within a channel when we move up and down between resistance and support. There’s a prominent crest or peak early on the 3rd followed by a notable decline off of that crest or peak. That decline continues on the 4th and into the 5th where we’ll have a rally with sideways fluctuations. Week Two (2/5-2/11) That rally moves us into a day’s high and a prominent crest for the month toward the end of the day on the 5th. On the 6th, we’ll establish a stable foundation along support, however on the 7th we’ll fall from that support down to a secondary support level. We’ll then rotate sideways along that support for a bit. On the 8th, we’ll rally into resistance but have multiple failed attempts to break through that resistance. On the 9th, we’ll rally into and break out through key resistance. That’s followed by a decline with consecutively lower spikes up on the way down. On the 10th, there’s a failed attempt to break through key resistance followed by a decline through key support. On the 11th, we’ll decline through a support level into a trough that we recently declined through once before. Week Three (2/12-2/18) On the 12th, there’s a notable and unexpected move to the upside into a prominent crest or peak early in the day. On the 13th, there’s a trade opportunity in the midst of bearish price swings. On the 14th, there’s a rally along a diagonal trend line that ends with a fast sudden move higher to reach a key resistance level. We’ll then break down through that diagonal trend line with increasing volatility on the way down. On the 15th, there’s a fast, sudden move higher. On the 16th, we’ll come up against a key resistance level again and I’m advised to open up some protection there. On the 17th, we’ll decline through multiple support levels from a highest high. There’s a trade opportunity at the end of the day. We’ll have sideways fluidity along key support on the 18th. Week Four (2/19-2/25) There’s a highest high early in the day on the 19th. There’s also the halting of a bullish trend marked by a decline through key support. On the 20th, there’s a rally along a diagonal trend line where we break through horizontal resistance to meet a secondary resistance level and then pull back to somewhere between those two price levels. On the 21st, there’s a notable decline through multiple support levels that stands out on a multi-day chart. On the 22nd, there’s a holding pattern and a pop and drop. The pop will be toward the end of the day and the drop is the following day on the 23rd. On the 24th, there’s an unexpected move higher. On the 25th, there’s an intentional fake out or shake out and possibly a false triggering of an indicator. There may be another highest high and a pop and drop on the 25th. Week Five (2/26-2/28) On the 26th, we’ll revisit a support level that was recently a past opportunity after a sharp dip in the midst of some sideways rotation. On the 27th, out of a decline we’ll move from the bottom of a range to the top of a range on the scale of a multi-day chart. On the 28th, we’ll have a notable reversal and big decline that stands out on a one-day chart. Sneak Preview In early March there’s a sharp decline. #XVTheDevil #PrinceofCups #XVIITheStar #5ofCups #QueenofWands #3ofWands #KnightofWands #KnightofSwords #7ofSwords #8ofSwords #0TheFool #IIITheEmpress #XXTheAeon #XVITheTower #AceofCups #5ofDisks #10ofWands #7ofCups #VITheLovers #4ofSwords #6ofDisks #XIITheHangedMan #PrincessofSwords #IITheUniverse #6ofCups #5ofSwords #XIXTheSun #7ofDisks #QueenofCups #3ofSwords #5ofWands #KnightofDisks #VIIIAdjustment #VTheHierophant #9ofSwords #UnicursalHexigram #3ofDisks #2ofCups #2ofWands #2ofSwords #KnightofCups #4ofWands #XILust #8ofDisks #AceofSwords #AceofWands #7ofWands #PrinceofWands #XXITheUniverse #10ofDisks #AceofDisks #ITheMagus #PrincessofCups #IXTheHermit #3ofCups #XVIIITheMoon #8ofWands #PrincessofWands #6ofWands
- February 2023 FLUX Predictions (Public Version)
Month’s Theme: A key resistance level on a multi-day chart is highlighted. There are two notable and unexpected moves to the upside. One is on the 1st and one’s on the 24th. Behavior Around the High: A sideways rotation along a key support level. There’s a fast, sudden move higher off of that sideways rotation into the high. Behavior Around the Low: Out of the low, there’s a sideways fluctuating rally that increases with bullish momentum. Overview Week One (2/1-2/5) On February 1st, there’s a high probability of a high. There’s a fake out or shake out and intentional misdirection, possibly a false triggering of an indicator. There may be a gap down overnight. On the 2nd, there’s a rally higher to meet resistance and a key support level highlighted on the 3rd. On the 4th, there’s a high probability of a lowest low. There’s a notable decline on the 4th. On the 5th, we’ll have a notable move higher. Week Two (2/6-2/12) There’s some sideways fluctuation on the 6th back and forth through the same price level three times. On the 7th, there are multiple failed attempts to break through key resistance on the scale of a one-month. On the 8th, there’s a decline through multiple support levels on the scale of a one-month chart. There’s a prominent trough on the cusp of the 8th or the 9th. We’ll rally out of that trough along a diagonal trend line in the first half of the day on the 9th. We’ll then decline through that diagonal trend line with increasing volatility on the way down. We’ll gap down into the morning of the 10th. Out of that, there’s a big move to the upside early in the day. We’ll then have some sideways fluctuating decline preceding a rally into the end of the 10th. On the 11th, there’s an agreement between two leaders and possibly a merger followed by a holding pattern and a pop and drop. There’s a prominent crest on the 12th as well as bearish price swings with a sharp drop into a lowest low on the 13th. Week Three (2/13-2/19) We’ll then rally to the upside out of that low with increasing momentum moving forward into the day on the 13th. On the 14th, there’s a failed attempt to break through key resistance. There’s a crest early in the day followed by a notable selloff on the 15th. On the 16th, there’s a breakout on the scale of a one-month chart. We’re bound by the top of a range on the 17th. There’s quite a bit of price movement on the 18th that continues into the 19th. Toward the end of the day, there’s a decline offering a trade opportunity. Week Four (2/20-2/26) On the 20th, erratic behavior back and forth through the same price level, in the midst of which we’ll revisit a crest that was recently a past opportunity. High probability of a highest high on or around the 20th. There’s a prominent crest or peak early in the day on the 21st that increases with momentum to the downside as we move forward in the day. There’s an important trough or bottom on the 22nd that will stand out. We’ll do some sideways rotation along key support on a one-month chart on the 23rd. On the 24th, we’ll establish support and have a significant move to the upside standing out on a one-month chart. There’s a high probability of meeting the highest high again at the end of the day on the 24th. We’ll reestablish support at a higher level after that move higher. That rally ends on the 25th. There’s a bit of a decline somewhere between the 25th and the 26th. Out of that decline, there’s a notable move to the upside on the 26th where we’ll turn old resistance into new support. There’s a probable highest high somewhere between the 26th and the 27th. Week Five (2/27-2/28) There’s a key technical price level highlighted around the 27th. It’s likely the highest high again. On the 28th, we’ll likely open lower and there’s a prominent move higher. That’s followed by a full retracement of that move back down. Sneak Preview Out of a decline, there’s a fast, sudden move higher marking the end of that decline. #PrincessofSwords #KnightofDisks #10ofSwords #XVTheDevil #PrinceofSwords #PrincessofDisks #AceofCups #XIXTheSun #3ofWands #8ofSwords #7ofDisks #KnightofWands #IIITheEmpress #VITheLovers #XVIIITheMoon #PrinceofWands #5ofCups #3ofSwords #VTheHierophant #4ofSwords #QueenofSwords #IITheUniverse #2ofSwords #3ofCups #XVIITheStar #XTheFortune #AceofSwords #KnightofCups #10ofCups #6ofWands #10ofWands #7ofWands #PrincessofCups #6ofCups #PrinceofCups #XIIIDeath #3ofDisks #10ofDisks #4ofWands #6ofDisks #6ofSwords #XIVArt #8ofDisks #VIITheChariot #XXTheAeon
- February 2023 Internet Computer (ICP) Predictions (Public Version)
Month’s Theme: A fast, sudden move higher crossed with erratic behavior back and forth through the same price level. In the midst of that erratic behavior we’ll revisit a crest that was recently a past opportunity. Behavior Around the High: Some price swings. Behavior Around the Low: We’ll establish key support on a multi-day scale. Out of the low, there’s a big move to the upside standing out on a one-month scale and we’ll establish support at a higher level. Overview Week One (2/1-2/5) On February 1st, we’ll have sideways rotation that increases with bullish momentum as we move forward into the day. On the 2nd, we’ll decline through a support level to meet a second support level and then rotate sideways along that support on the scale of a multi-day chart. On the 3rd, there’s a failed attempt to break through key resistance that we recently failed to break through. That’s followed by a false establishment of support. On the 4th, there’s an unexpected move to the upside toward the end of the day after a bit of a decline. That move to the upside may continue into the 5th. I’m advised to open up protection around the cusp of the 4th and the 5th. On the 5th, we’ll rally along a diagonal trend line increasing with momentum as we move into resistance. That’s followed by a notable decline off of that resistance level. Week Two (2/6-2/12) On the 6th, there’s sideways rotation and a prominent trough, by prominent meaning it’s not the lowest low but it stands out on a chart. There’s also a fast, sudden move higher marking the end of that sideways rotation. On the 7th, we’ll be bumping along resistance and see a prominent crest or peak for the month on the 8th. From that crest or peak there’s a notable decline. On the 9th, we’ll have a fast, sudden move higher early in the day after establishing support on a multi-day scale. We’ll then break down through a key support level into a prominent low that’s likely late on the 9th or early on the 10th. We’ll decline into the 10th. We may revisit a crest on the 10th or 11th. There’s a key resistance level highlighted on the 12th. We’ll decline pretty significantly from that resistance level. Week Three (2/13-2/19) On the 13th, we’re bound by the upper end of a range. That’s followed by a sharp dip after some sideways rotation. On the 14th, there’s a notable move to the upside. On the 15th, there’s a sideways S-formation and a fast, sudden move higher standing out on a one-month chart. On the 16th, we attempt to establish support at the upper end of a range. On the 17th, there’s a period of volatility that ends with a fast, sudden move higher. That volatility continues into the early morning on the 18th, and there’s an unexpected move higher and a prominent crest or peak toward the end of the day. There’s a sharp decline through multiple support levels on the 19th. Week Four (2/20-2/26) There’s a big move to the upside overnight on the 19th or early on the 20th. There’s a prominent crest toward the end of the day on the 20th. There’s also three pokes through the same price level followed by a sharp decline after the third poke on the 20th. On the 21st, an important resistance level is highlighted and volume flattens out a bit around that price level. We’ll have bearish price swings on the 22nd with a sharp drop that will stand out. On the 23rd, we’ll rotate sideways along key support on a multi-day chart. We’ll rise to meet the nearest critical resistance and then fall back down to support and continue rotating sideways. On the 24th, there’s a prominent crest or peak late morning and there’s a sharp dip amidst some intentional misdirection that’s indicated through a chart pattern. On the 25th, we’re rallying along a diagonal trend line before a fast, sudden move higher and a sharp drop through that diagonal trend line with increasing volatility on the way down. There’s a prominent crest or peak on the 26th in the midst of multiple failed attempts to break through key resistance. There’s also a notable move higher toward the end of the day on the 26th. Week Five (2/27-2/28) There may be another month’s high around the 27th or 28th. There’s a decline that ends with a fast, sudden move higher on the 27th. There’s some sort of decision between two leaders that’s highlighted on the 28th and that’s possibly accompanied by a pop and drop. Sneak Preview There’s a resistance level highlighted in March. It may be the same resistance level that we see between the 20th and 21st of February. My sense is that something important, either positive or negative, happens between the 8th and 12th of March. #IITheUniverse #2ofWands #10ofSwords #PrinceofDisks #5ofDisks #5ofCups #XVIITheStar #PrinceofSwords #KnightofDisks #7ofWands #XVITheTower #AceofWands #AceofCups #AceofSwords #10ofWands #XIXTheSun #XIITheHangedMan #IXTheHermit #8ofWands #QueenofWands #PrincessofDisks #IVTheEmperor #QueenofDisks #6ofCups #XTheFortune #5ofWands #2ofSwords #QueenofCups #4ofDisks #KnightofSwords #7ofSwords #7ofCups #3ofSwords #4ofSwords #XVIIITheMoon #3ofDisks #XVTheDevil #KnightofWands #8ofSwords #KnightofCups #VITheLovers #3ofWands #10ofDisks #ITheMagus
- February 2023 S&P 500 Predictions and Trades
Month’s Theme: A period of sideways rotation and the revisiting of a recent past opportunity at a support level, likely in the midst of a sharp dip on a one-month chart. There’s also a decline through multiple support levels into a prominent low or trough. Behavior Around the High: There’s a notable rally into a critical technical price level. Behavior Around the Low: A sharp decline due to multiple headwinds will take us into the lowest low. Trade Opportunities: An opportunity midday at a peak on the 1st. There’s an opportunity to open up protection around that peak before a reversal. I would close that protection at the end of the day. There’s also an opportunity in the morning to open up a long position in the midst of a decline on the 1st. I would close that long position midday. An opportunity to open a short position at a resistance level on the 3rd. I would close that short position on the 9th. An opportunity on the 10th to trade around multiple failed attempts to break through key resistance on a one-day chart. On the 13th, I would trade around sideways fluctuations with a bullish trend preceding a decline on a one-day chart. On the 17th, there’s an opportunity for a day trade around a peak or crest toward the end of the day. If we don’t see a lowest low this day, I would hold off on that trade. For a swing trade, I would open up a long position in the midst of meeting that lowest low. You could close that long position in the midst of a notable move higher midday on the 21st. If you have more risk tolerance, you could close that long position on the 24th in the midst of a rally. An opportunity to open a short position on the 24th and close that position on the 27th when we’re rotating sideways along key support on a one-month chart after a bit of a decline. Overview Week One (2/1-2/3) On February 1st, we’ll have a prominent low and a day trade opportunity. On the 2nd, there’s a prominent low after a notable decline through a key support level on a one-month chart. On the 3rd, there’s a high in the midst of a notable amount of volatility. There should be some significant price changes there that give the opportunity to possibly position oneself in both directions for a multi-month trade. We’ll revisit a recent past opportunity there. I’m advised not to chase the rally into the high. There’s a highest high and a prominent trough on the 3rd. Week Two (2/6-2/10) On the 6th, there’s a prominent trough toward the end of the day. There’s a sharp drop that will stand out on a one-month chart in the midst of a period of volatility. On the 7th, there’s a notable move higher out of a decline from the bottom of a range to the top of a range. On the 8th, we’ll have three crisscrosses through the same price level confirming a bullish trend, however that bullish trend doesn’t hold. On the 9th, we’ll have a notable decline that stands out on a one-month chart. We’ll move into the lowest low or a lowest low for the month. We’ll also revisit a past opportunity at a support level that we meet on the 9th. There’s a significant drop and another lowest low on the 10th. There’s an agreement between two leaders that’s highlighted on the 10th that creates the sharp decline. Week Three (2/13-2/17) There are multiple failed attempts to break through key resistance and a sharp decline into the low on the 13th. There’s a sideways S-formation within a channel on the 13th. On the 14th, there’s a near overbought crest that we’ll sell off from. We’ll establish support midday on the 15th. Off of that support level, we’ll move notably higher and create a new support level. On the 16th, we’ll bump up against resistance, break through resistance, and bump up against resistance again. We’ll also have a prominent crest at the beginning of the day on the 16th. On the 17th, we’ll have a period of sideways rotation that ends with a fast, sudden move higher marking the end of that period of sideways rotation. I’m advised to open up protection in the midst of that move to the upside. We may see the lowest low for the month on the 17th. Week Four (2/21-2/24) The market is closed on the 20th. On the 21st, there’s a notable move to the upside that pushes the upper end of a range higher. We’ll have a high midday. On the 22nd, we’ll establish new support and push notably higher, however we’ll then decline off of a crest or peak. On the 23rd, we’re bound by a range. We’ll revisit a past opportunity at a support level. We’ll then rally into a highest high on the 24th. That rally will offer an opportunity to open up a short position. Week Five (2/27-2/28) On the 27th, there’s some sideways rotation along key support into another prominent crest or peak midday. That’s followed by a notable decline off of that crest or peak. Overnight on the 27th and into the 28th, there’s a notable move to the downside and a big move higher out of oversold territory. Sneak Preview In March, we’ll establish a solid support level. A male ruler of nations is highlighted on a one-month scale. #3ofCups #6ofSwords #QueenofWands #AceofDisks #XIITheHangedMan #PrincessofSwords #QueenofSwords #9ofWands #3ofWands #AceofCups #VITheLovers #2ofCups #5ofDisks #QueenofDisks #IIITheEmpress #PrinceofSwords #7ofCups #8ofSwords #10ofSwords #VIITheChariot #VTheHierophant #IVTheEmperor #QueenofCups #9ofCups #10ofDisks #7ofWands #KnightofDisks #XXTheAeon #9ofDisks #10ofWands #PrincessofWands #PrinceofDisks #VIIIAdjustment #XVIITheStar #9ofSwords #IXTheHermit
- February 2023 DOGE Predictions (Public Version)
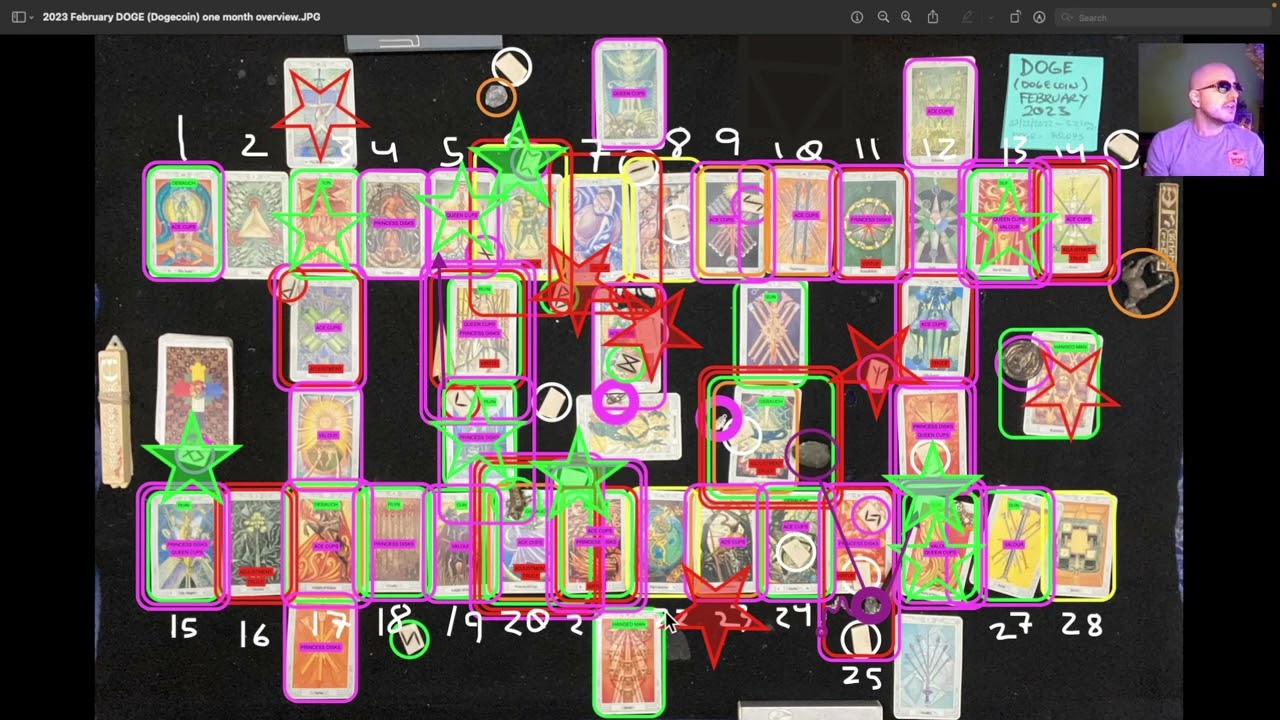
Month’s Theme: A prominent move to the upside followed by a full retracement back down. There’s also a notable move to the upside that increases with momentum moving forward into key resistance on the scale of at least a one-month chart. Behavior Around the High: A U-shaped dip that forms near the intersection of two perpendicular diagonal trend lines. Behavior Around the Low: A sell-off from an overbought crest or peak that will stand out on a one-month chart into the low. Exclusive Trade Opportunities for Subscribers: On the 1st, there’s an opportunity to open a long position in the midst of a decline. I would sell that position early in the day when we’re rotating along a support level. There’s an opportunity to open a long position on the 5th in the midst of a decline toward the end of the day. I would sell that position early to midday on the 6th at a highest high. A day trade opportunity on the 9th to open a long position in the midst of a decline. I would sell that position toward the end of the day. If you can, I would also buy protection on the 9th and close out of that protection in the midst of a decline on the 10th. An opportunity to open a long position on the 10th and close it on the 11th when we’re rotating sideways along key support. On the 13th, there’s a day trade opportunity to open a long position in the midst of a decline. On the 15th, there’s a day trade opportunity to open a long position in the midst of a decline. I would close that long position when we’re rotating along key support at a highest high. A swing trade opportunity to open a long position in the midst of a decline early to midday on the 20th. I would close that long position the following day early in the morning. There’s a day trade opportunity to open a short position early in the morning on the 21st. I would close that short position when we’re rotating along key support on the same day. An opportunity to open a long position on the 23rd at a support level. I would close out of that long position on the cusp of the 25th and the 26th. Overview Week One (2/1-2/5) On February 1st, there’s a notable move to the upside that pushes the upper end of a range higher. There’s also a bit of a decline on the 1st. On the 2nd, we’ll establish support and rotate sideways for a bit. We’ll then move up to the nearest resistance and then come back down to continue rotating sideways along support. On the 3rd, there’s a rally that increases with momentum moving forward into a prominent crest or peak for the month. On the 4th, we’ll have sideways rotation that increases with bearish momentum after a bit of a move to the upside to reach a resistance level. On the 5th, there’s another prominent crest or peak from which we sell down to and through a support level. We’ll do a U-shaped reversal below that support level and then move back upward to reuse it as support. Week Two (2/6-2/12) There’s a highest high price level early on the 6th. There’s an unexpected move to the downside off of that price level to a lowest low for the month either on the 7th or the 8th. There’s an unexpected move to the upside on the 7th and a cessation of a trend early on the 8th followed by a notable fake out/shake out or some sort of intentional misdirection on the 8th. Out of a decline on the 9th, we’ll have a move from the bottom of a range to the top of a range. On the 10th, we’re bound by the upper end of a range. There should be a notable drop between the 10th and 11th. We’ll have the completion of a rally on the 11th. On the 12th, we’ll establish support at a low, and out of that support we’ll have a notable move to the upside that stands out on a one-month chart. Week Three (2/13-2/19) A rally to the upside continues into the 13th and takes us into a prominent crest or peak for the month. On the 14th, there’s a day’s crest at the end of the day and a key resistance level on a multi-day scale that stands out. There’s a notable decline between the 14th and the 15th. Out of that decline, there’s a big move to the upside on the 15th. On the 16th, we’ll have three pokes through the same price level followed by a sharp decline after the third poke. We’ll rally into the 17th along a diagonal trend line. That rally ends with a fast, sudden move higher, and then we’ll have a breakdown through that diagonal trend line with increasing volatility on the way down. We’ll decline into a prominent trough or low for the month on the 18th. There’s a big move to the upside out of that trough. There’s some sideways rotation or another fast, sudden move higher on the 19th. Week Four (2/20-2/26) On the 20th, there’s a decline that offers a significant trade opportunity. On the 21st, there’s a highest high early in the day from which we’ll decline notably on the scale of a one-month chart. That decline continues into the 22nd and possibly into early on the 23rd. We’ll have some sideways rotation and a sharp dip within that rotation to bring us to a lowest low price level on the 23rd. There’s a significant trough or bottom on the 24th. A stable foundation for support forms on the 25th. We’ll then rally into a highest high off of that support either on the cusp of the 25th and 26th or on the 26th (which is more probable). At the end of the day on the 26th, there’s a sharp decline off of a highest high. Week Five (2/27-2/28) On the 27th, we’ll rally back into a key resistance level on a multi-day scale, and from there we’ll decline with consecutively lower spikes up on the way down. We’ll reestablish support on the 28th and see the beginning of a rally. Sneak Preview In early March, we’ll sell from a near overbought peak or crest. #XIITheHangedMan #IITheUniverse #7ofCups #XXTheAeon #3ofDisks #PrinceofWands #PrinceofDisks #4ofCups #0TheFool #XVIITheStar #XVTheDevil #9ofWands #10ofWands #4ofWands #9ofDisks #AceofWands #2ofSwords #4ofSwords #PrincessofDisks #XIVArt #7ofWands #VIIIAdjustment #XIXTheSun #QueenofCups #PrinceofSwords #AceofCups #10ofSwords #ITheMagus #3ofSwords #KnightofWands #9ofSwords #KnightofDisks #KnightofCups #XVITheTower #XXITheUniverse #QueenofDisks #XIIIDeath #IVTheEmperor #PrincessofWands #5ofWands #4ofDisks #3ofWands #10ofCups #7ofSwords
- January 13, 2023 S&P 500 Predictions (RATED)
*Accuracy rating update: 83% or 10/12 predictions correct* Day’s Theme: N/A Behavior Around the High: We’ll hit a key resistance level around the high. Behavior Around the Low: The day’s low will likely be toward the end of the day. Trade Opportunities: An opportunity to open up a long position in the midst of a decline toward the end of the day. Overview On January 13th, we’ll open at the same price level or higher than on the 12th. We’ll have a high earlier in the day followed by a sharp drop from that high. There’s another crest or higher high midday. We’ll hit key resistance around that high and then break down with consecutively lower spikes up on the way down. We’ll then bounce along a support level and then break down through more support levels. In the midst of that decline into the end of the day, we’ll have an opportunity to open up a long position. The decline will likely bring us into the day’s low. That decline ends with a fast, sudden move to the upside. A key resistance level is highlighted around the close or in the post-market. Sneak Preview My sense is that we’ll open higher on the 17th. #10ofDisks #XIVArt #7ofWands #ITheMagus #3ofSwords #QueenofWands #XIITheHangedMan #VIITheChariot #5ofWands #7ofCups #PrincessofCups #KnightofCups #PrinceofSwords #KnightofWands #9ofDisks #7ofSwords
- January 11, 2023 S&P 500 Predictions (RATED)
*Accuracy rating update: 100% or 7/7 predictions correct* Day’s Theme: A prominent move higher that stands out on a multi-day chart, however that move higher is a fake out. Behavior Around the High: There’s a significant decline off of the high that increases with momentum moving forward into the day. Behavior Around the Low: There’s an opportunity to position oneself in both directions around the low. Trade Opportunities: A trade opportunity in the last hour around an agreement between two leaders or a merger of some kind. Overview On January 11th, there’s a critical technical price level highlighted in the pre-market. We’ll decline from that price level into a low either in the pre-market or around the open. There’s a move to the upside at some point in the first hour and a half. There’s likely a drop within that move to the upside and that slight drop is followed by a high. That high is formed at a failed attempt to break through key resistance that’s likely on a multi-day chart. Between 1:00 p.m. and 2:00 p.m., we’ll have a move higher through resistance and then break back down through that price level shortly thereafter. We’ll have a day’s low around this time. An agreement between two leaders or a merger of some kind is highlighted in the last hour. There’s a trade opportunity around a sharp decline into another low around the close. Sneak Preview A notable decline midday that will stand out on a multi-day chart. #10ofDisks #ITheMagus #PrinceofCups #3ofDisks #6ofSwords #QueenofSwords #5ofCups #9ofDisks #3ofCups #PrincessofSwords #7ofDisks #VITheLovers #XIIIDeath #XVTheDevil #AceofSwords #AceofCups
- January 10, 2023 S&P 500 Predictions (RATED)
*Accuracy rating update: 100% or 8/8 predictions correct* Day’s Theme: Senate is highlighted but somehow nullified. There may be a holding pattern of some sort. Behavior Around the High: We’ll likely see a pop-and-drop around the high. There’s price action that cancels out the move into the high being relevant. Behavior Around the Low: Selling from a crest down to and through a support level on the scale of a one-day chart. We’ll have a U-shaped reversal below that support level and then move back up to reuse it as support. Trade Opportunities: A rally to the upside around the open that offers an opportunity to open a short position. An opportunity to position oneself in both directions at a resistance level midday. Overview On January 10th, we’ll have a move higher through resistance followed by decline back down through that same price level in the pre-market. There’s a rally to the upside out of that decline around the open that offers an opportunity to open up a short position. This will be followed by a sharp drop to a support level that we’ll rotate alongside in the first half hour. We may have another low midday. There’s some volatility and a resistance level that’s highlighted midday. That resistance level is a good price level to position oneself in both directions. We’ll then rally to the upside into an overbought crest or peak. This is followed by a decline off of that overbought crest or peak at some point in the last few hours. Sneak Preview An overall bearish day. There will be a sideways S-formation after a decline, a rally, and then another decline. #VTheHierophant #XXITheUniverse #VIIIAdjustment #10ofDisks #3ofCups #3ofDisks #ITheMagus #8ofDisks #PrincessofSwords #9ofDisks #10ofCups #XVIIITheMoon #9ofSwords #AceofWands #4ofCups #QueenofCups
- January 9, 2023 S&P 500 Predictions (RATED)
*Accuracy rating update: 100% or 10/10 predictions correct* Day’s Theme: A key resistance level is highlighted. There will be selling from a near overbought crest or peak. Behavior Around the High: The high will be at an overbought crest or peak and will form out of a rally that’s halted. Behavior Around the Low: Out of the low, we’ll push the upper end of a range higher on the scale of at least a one-day chart. Trade Opportunities: An opportunity to open up a long position amidst a move higher around the open. Overview On January 9th, there’s an opportunity to open up a long position before a notable move higher out of a decline around the open. In the first half hour, we’ll bump up along resistance and then break through that resistance level. We’ll have some halting and then see a notable move higher around roughly 11:00 a.m. or noon. The day’s high is either at noon or between 1:00 p.m. and 2:00 p.m. There will likely be a low between 1:00 p.m. and 2:00 p.m. as well. Around noon, we’ll have three pokes through the same resistance level, stay above it briefly, and then have a sharp drop after the third poke. We’ll have some bullish price swings between 2:00 p.m. and 3:00 p.m. and then that begins to turn into a decline. There may be a move higher in the last hour, but that move higher will be followed by a full retracement. Sneak Preview A decline that increases with momentum moving forward into the day. #4ofWands #KnightofSwords #XIITheHangedMan #10ofWands #PrincessofCups #7ofWands #4ofWands #AceofWands #3ofSwords #XIIIDeath #2ofWands #XIVArt #8ofWands #7ofSwords #XXTheAeon #PrinceofCups
- January 6, 2023 S&P 500 Predictions (RATED)
*Accuracy rating update: 100% or 9/9 predictions correct* Day’s Theme: A fast, sudden move to the upside marking the end of a decline. Behavior Around the High: N/A Behavior Around the Low: N/A Trade Opportunities: I’m advised to open up protection around the day’s first crest between roughly 10:00 a.m. and 11:00 a.m. Overview On January 6th, we’ll move to the upside and push the upper end of a range around the open. We’ll then sell from near overbought territory after that move to the upside. This is followed by a prominent move to the upside and then a full retracement back down and to a support level. We’ll have some sideways rotation along that support level. We’ll have a crest between roughly 10:00 a.m. and 11:00 a.m. I’m advised to open up protection around this crest. There may be something important related to a speech around noon. It’s advised that this speech is intentionally misleading. We’ll see another crest midday followed by a sharp drop off of that crest. There will be some sideways rotation followed by another sharp drop. We’ll then have a significant move into another crest, however this is a fake out and we’ll begin to decline around 2:00 p.m. and into the end of the day. Sneak Preview We’ll move higher through resistance into a peak and stay above resistance briefly before breaking back down. #KnightofCups #7ofSwords #QueenofDisks #10ofSwords #XXTheAeon #9ofCups #XIVArt #5ofDisks #XXITheUniverse #XIXTheSun #XVTheDevil #VITheLovers #KnightofWands #9ofDisks #QueenofCups
- January 5, 2023 S&P 500 Predictions (RATED)
*Accuracy rating update: 100% or 7/7 predictions correct* Day’s Theme: A notably big move out of oversold territory that will stand out on a one-day chart. Behavior Around the High: A completion of a bullish trend for the day around the high. Behavior Around the Low: Erratic behavior back and forth through the same price level. In the midst of that erratic behavior, we’ll revisit a crest that was recently a past opportunity. It looks like the low will be around the end of the day after a significant move to the upside. Trade Opportunities: A drop into a low at the end of the day offers an opportunity to open up a long position. Overview On January 5th, there’s a fake out followed by a decline out of the open. We’ll see sideways fluctuations with a bearish trend into roughly 11:00 a.m. Around late afternoon or midday, there’s a big move to the upside that pushes into a day’s high. We’ll have a lot of conflicting energy into the afternoon. We’ll see three crisscrosses through the same price level confirming a bullish trend before moving into the high. The high is likely around 1:00 p.m. to 2:00 p.m. There’s a lot of bullish energy today, however we may move into a day’s low around the close. The drop into that low offers an opportunity to open up a long position. #ITheMagus #4ofCups #4ofWands #7ofCups #9ofSwords #XVTheDevil #IIITheEmpress #9ofDisks #3ofWands #PrinceofWands #XIXTheSun #VITheLovers #9ofCups #AceofSwords #6ofCups #7ofSwords