Search Results
Search this site
2352 results found with an empty search
- October 24, 2022 S&P 500 Predictions (RATED)
*Accuracy rating update: 93% or 14/15 predictions correct* Day’s theme : A lot of movement. An important price level is highlighted. Behavior around the high : A sharp dip in the midst of sideways rotation around the high. Behavior around the low : A notable drop to meet the low, likely a decline through multiple support levels or a gap down of some sort. Trade opportunities : An opportunity to open up a short position off of a day’s high earlier in the day. Another trade opportunity around midday to position yourself in both directions. Overview : On October 24, 2022, we push the upper end of a range either in the pre-market or right around the open. There’s also some selling around the open. We then turn around to reuse a support level. In the first half hour, there’s a big move to the upside where we push the upper end of a range. We’ll see a day’s high at some point in the first hour and a half. That high is followed by a decline, which marks an opportunity to open up a short position. Midday, we have a move higher through a resistance level, followed by a breakdown through that same price level shortly thereafter. There’s a trade opportunity to position yourself in both directions just a bit after midday. Around 2:00 p.m., we’ll see a trough followed by a big move to the upside out of that trough. That move to the upside forms a crest and another high for the day, and we’ll likely meet a new support level here, at least momentarily. This marks an opportunity to open up a short position. Between 2:00 p.m. and 3:00 p.m., we have a day’s low off of the previous crest. We then decline again into another day’s low toward the end of the day. In the post-market, we break down through a diagonal trend line that we rally along with increasing volatility as we move into the next day. #6ofSwords #XVITheTower #QueenofDisks #9ofDisks #XVIITheStar #XXTheAeon #XXITheUniverse #PrincessofWands #2ofCups #PrincessofSwords #5ofWands #VTheHierophant #KnightofWands #4ofCups #7ofDisks #2ofWands
- September 29, 2022 S&P 500 Predictions (RATED)
*Accuracy rating update: 100% or 15/15 predictions correct* Theme : A notable decline that may have to do with a global issue. Behavior around the high is to and through some support levels, however that behavior is nullified in some way. We’ll have bullish price swings out of the low. Overview : In the pre-market on September 29, 2022, there’s a move higher through a resistance level. We stay above that level briefly and then break back down through the same price level. We’ll see a lot of movement in the pre-market and the first half hour of trading. Around the open, it looks like we’ll have three criss-crosses through the same price level into a decline. In the midst of that decline, there’s an opportunity to open up a long position. Somewhere in the first half hour we meet a low. Between roughly 10:00 a.m. and 11:00 a.m. there’s a rally, and in the midst of that rally there’s an opportunity to open up a short position or close that long position. It looks like there’s a reversal from a trough somewhere around 10:30 a.m. Between roughly 11:00 a.m. and noon the rally continues. There’s another trade opportunity, possibly around midday, marked by a fast, sudden move to the upside. That sudden move marks a trade opportunity before we break down through a diagonal trend line. From roughly 1:00 p.m. to 2:00 p.m., there’s a diagonal trend line that we break down. There’s a prominent decline on a one-day chart moving in toward the afternoon. Out of that decline, there’s a move from the bottom of a range all the way to the top of a range, followed by sideways rotation along a support level somewhere around 3:00 p.m. to 4:00 p.m. There’s a cash out opportunity and a break down through multiple support levels from a crest right around the close. There’s some sort of disappointment or unpleasant surprise around the close. We’ll see another low in the post-market. It appears that quite a bit of ground is covered overnight. #XXITheUniverse #5ofDisks #8ofCups #7ofDisks #3ofCups #PrincessofCups #PrincessofWands #PrinceofWands #8ofWands #AceofCups #9ofWands #PrinceofDisks #QueenofWands #3ofWands #2ofWands #PrinceofSwords
- September 27, 2022 S&P 500 Predictions (RATED)
*Accuracy rating update: 100% or 15/15 predictions correct* Theme: A fast, sudden move higher marking the end of a period of decline. Overview: On September 27, 2022, there’s a fake out and a notable low in the pre-market. There’s a trade opportunity right around the open. We’ll see a low followed by a high. From that high, there’s a drop down through a support level to meet a secondary support level. We’ll bump along that support level before breaking down through multiple support levels. From roughly 10:00 a.m. to 11:00 a.m., there’s a notable and unexpected move to the upside. Between roughly 11:00 a.m. and noon, there’s a notable decline followed by a move to the top of a range. We have a reversal midday. This looks like a pretty significant trade opportunity. It’s possible that we have both a high and a low between the hours of 11:00 a.m. and 2:00 p.m. Between roughly 1:00 p.m. and 2:00 p.m. there’s a notable decline from a prominent crest on a one-day chart. There’s a trade opportunity in the midst of that crest. I’m advised to open up some protection because we have a notable decline that commences from that crest. From the crest, we decline into a trough, and that’s followed by a breakout in the last hour, however it doesn’t last long. There’s some erratic behavior back and forth through the same price level. We have a notable decline in the post-market or overnight that marks an opportunity to open up a long position. #PrinceofDisks #10ofWands #VIIIAdjustment #6ofCups #XVTheDevil #7ofCups #XVIITheStar #9ofWands #XTheFortune #XVITheTower #10ofDisks #5ofCups #AceofCups #QueenofSwords #4ofDisks #KnightofWands
- December 2022 S&P 500 Predictions
Month’s theme : Sideways rotation with a sharp dip in the midst of that sideways rotation. Behavior around the high: The high will likely be in the third week of the month. We’ll have an unexpected failure to break through a resistance level on at least a one-month chart and then decline through support. Behavior around the low: We’ll have quite a bit of volatility around the low. There’s also an important resistance level that’s highlighted. There’s a swing trade opportunity around the low that involves an intentional fake out or shake out. Trade opportunities : A swing trade opportunity on the 6th. A swing trade opportunity on the 8th involving a rally along a diagonal trend line that ends with a fast, sudden move higher. A trade opportunity toward the end of the day on the 19th or early on the 20th in the midst of selling from a peak or crest on a one day chart. A swing trade opportunity on the 27th involving a key resistance level on a one-day chart. Overview: Week One (12/1-12/2): On December 1st, we’ll have a move to the upside out of a trough. We’ll then see a notable move higher out of that trough on the 1st and into the 2nd, and then we’ll see a decline off of that move to the upside. Week Two (12/5-12/9): The first month’s low will be somewhere between the 2nd and the 5th. On the 5th, there will be a gap up and a notable amount of price movement. On the 6th, we’ll have sideways fluctuations with a bearish trend preceding a rally. There’s a swing trade opportunity early in the day on the 6th. There’s likely a sharp dip on the 6th as well. On the 7th, it looks like we’ll have a rally to reach a key resistance level on a one-month chart. We’ll hit that resistance level and then break down with consecutively lower spikes up on the way down. On the 8th, there may be another sharp dip, however we’ll also have a prominent move higher on a one-month chart. That move higher will be followed by a full retracement back down. There’s a swing trade opportunity on the 8th involving a rally along a diagonal trend line that ends with a fast, sudden move higher. On the 9th, we’ll have bullish behavior and will continually bump along resistance and then break through resistance. Week Three (12/12-12/16): On the 12th, it looks like we’ll have another peak or crest. We’ll sell down pretty significantly from that peak or crest toward the end of the day. There’s an agreement between two parties or a merger of some kind that’s highlighted on the 13th in the midst of selling from that peak or crest. We’ll also have a holding pattern followed by a pop up and then a drop on the 13th. There’s a lot of price movement toward the end of the day on the 13th and into the 14th. There are multiple failed attempts to break through key resistance on the 14th. On the 15th, we’ll have a sharp dip to meet a key support level in the midst of sideways rotation. We’ll rise to meet key resistance on a one-month scale and then fall back down to continue rotating along key support. We’ll see a significant move to the downside in the midst of sideways fluctuation between the 15th and the 16th. On the 16th, there’s quite a bit of price movement to the upside that precedes a decline on the 19th from a crest or peak. Week Four (12/19-12/23): On the 19th, we’ll sell down from a crest or peak with increasing momentum as we move forward into the day. There’s a swing trade opportunity involving a significant drop from a prominent peak or crest on at least a one-day chart. I’m advised to place a trade toward the end of the day on the 19th or early on the 20th in the midst of selling from a peak or crest on a one day chart. On the 20th, we’ll have a notable decline on a one-month chart to reach a key support level. That decline will continue into the 21st and will probably reach the month’s low. There’s a prominent peak that will stand out midday on the 21st, however this is followed by a sharp drop on a one-month chart. We’ll likely meet the previous key support level one more time. On the 22nd, we’ll have a big move to the upside that reaches for distant resistance and a trade opportunity at that high. I’m also advised to open up protection at this time. We’ll have three failed attempts to break through key resistance on the 23rd. Week Five (12/27-12/30): The market is closed on the 26th. On the 27th, we’ll likely gap down early in the morning. This is followed by a big move to the upside that reaches for distant resistance out of oversold territory. There’s a swing trade opportunity here involving a key resistance level on a one-day chart. We’ll also see a sharp drop on a one-month chart on the 27th. On the 28th, we’ll have three pokes through the same price level followed by a sharp drop after the third poke. On the 29th, we’ll have sideways price swings and a swing trade opportunity involving selling from a notable peak or crest on a one-day chart. On the 30th, there will be a move higher through a key resistance level on a one-month chart. We’ll stay above that resistance level briefly and then break back down through the same price level shortly thereafter. Sneak preview: We’ll have the completion of a bullish trend in January. #XIITheHangedMan #5ofCups #XTheFortune #9ofDisks #XVIITheStar #0TheFool #IIITheEmpress #5ofWands #XIVArt #7ofWands #10ofCups #VITheLovers #8ofSwords #3ofDisks #VIITheChariot #10ofDisks #XVTheDevil #QueenofDisks #KnightofWands #XIIIDeath #XVITheTower #QueenofSwords #2ofSwords #PrinceofCups #AceofDisks #XXITheUniverse #XILust #IVTheEmperor #XXTheAeon #VIIIAdjustment #3ofSwords #2ofWands #3ofCups #KnightofSwords #PrinceofSwords #8ofCups
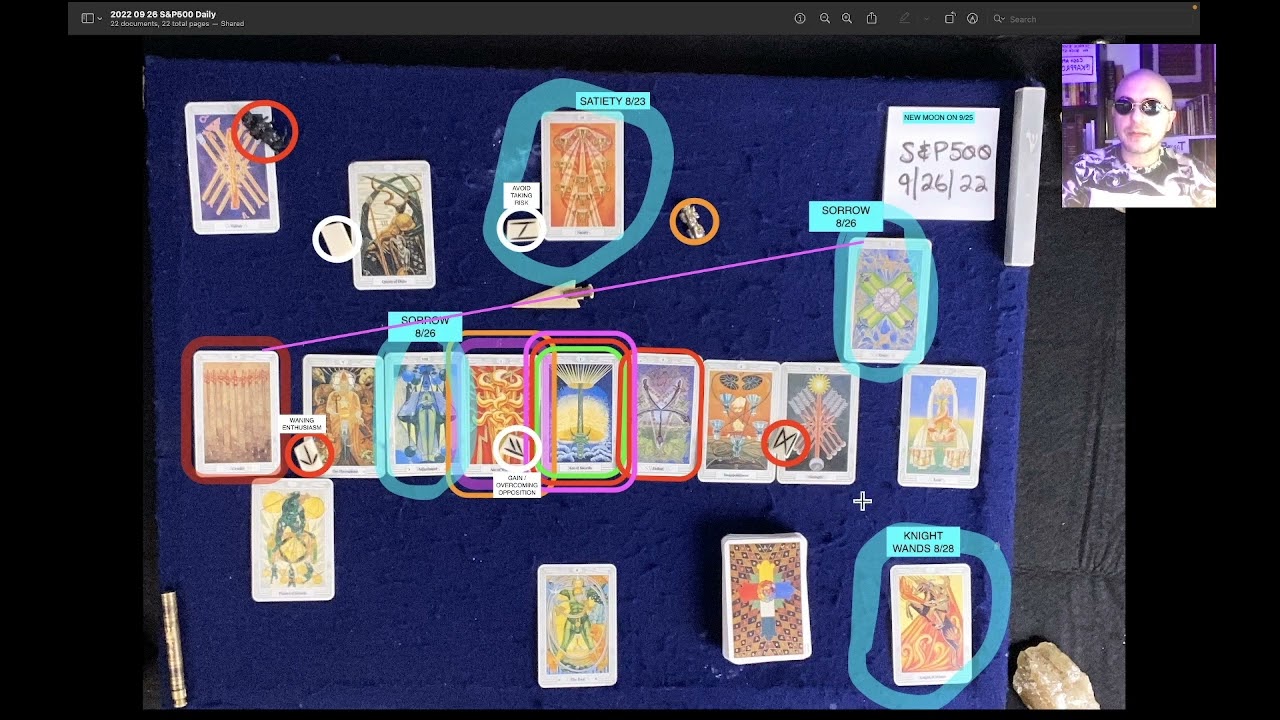
- September 26, 2022 S&P 500 Predictions (RATED)
*Accuracy rating update: 94% or 17/18 predictions correct* Theme: Quite a bit of bumping sideways along resistance mixed with a notable decline. Around the high, we’ll have selling from overbought territory on the RSI. It looks like we either have a pretty deep decline into the low or a pretty notable move higher out of the low, or even possibly both. I’m advised to trade around a sharp dip within a period of sideways rotation along a support level. Overview : For September 26, 2022, we have a bit of bullish volatility that wanes right at the open. We then either have a holding pattern in the first half hour due to congress or there’s a move higher followed by a full retracement back down. Roughly between 10:00 a.m. and 11:00 a.m., we have a notable move to the upside either from oversold territory or to fill a previous gap down. That move higher continues into the middle of the day where we have quite a bit of volatility. We meet a key resistance level on a one-day chart. We meet a high from this rally. There’s a trade opportunity where we attempt to establish support. After establishing support, we rotate alongside it for a bit. There’s a sharp dip within that period of rotation which brings us to another day’s low roughly between 1:00 p.m. and 2:00 p.m. This decline is marked by a failed attempt to break through key resistance followed by a decline through key support on a one-day chart. Between roughly 2:00 p.m. and 3:00 p.m., we have a move higher to retest a resistance level. It will be expected that we break out through that resistance level but we fail to do so. We turn around and decline pretty sharply around 3:00 p.m. In the last hour, there’s a move out of that decline from the bottom of a range to the top of the range. We’ll also revisit a price level that we likely saw early on in the pre-market right around the close. In the post-market, there’s a move higher to and through a resistance level followed by a decline back down through that same price level shortly thereafter. #7ofWands #QueenofDisks #10ofCups #4ofSwords #9ofSwords #VTheHierophant #VIIIAdjustment #AceofWands #AceofSwords #5ofSwords #5ofCups #9ofWands #2ofCups #PrinceofSwords #0TheFool #KnightofWands
- November 1, 2022 S&P 500 Predictions (RATED)
*Accuracy rating update: 93% or 13/14 predictions correct* Day’s theme : A rally that offers an opportunity to open up a short position to protect against long positions. There’s also a decline in the midst of a rally that presents an opportunity to open up a long position. Behavior around the high : N/A Behavior around the low : A fast, sudden move to the upside out of the low around 1:00 p.m. or 2:00 p.m. Trade opportunities : There’s an opportunity to open up a short position for a day trade early in the day. I’m advised to sell the puts bought in the morning around midday. There’s another opportunity to buy calls around midday for an overnight swing trade. I’m advised to sell these around the open the following day. Overview: On November 1st, we’ll likely open lower than where we closed on the last day of October. In the pre-market, we’ll see the completion of a rally. There’s a trade opportunity at the first low for the day early in the morning. We’ll see a move to the upside that marks an opportunity to open up a short position. If you’re planning on day trading, I would sell that short position around 1:00 p.m. From the decline right around the open, we’ll see a big move to the upside that reaches for a distant resistance on a one-day chart in the first half hour. Around 10:00 a.m. or 11:00 a.m., there’s a decline through key support after failing to break through resistance. It looks as though we’ll decline through 1:00 p.m. or even into the 2:00 p.m. hour. Right around 1:00 p.m. is when I would sell the puts purchased this morning for a day trade. There’s another trade opportunity around this time to buy calls for an overnight swing trade. A low for the day will be between 1:00 p.m. and 2:00 p.m., and we’ll see a fast, sudden move to the upside out of that low. We’ll also have some erratic behavior back and forth through the same price level around this time, followed by the revisiting of a crest that was recently a past opportunity. In the last hour of trading, there will be a notable rally that commences. In the midst of this rally, I’m advised to open up a short position for a long-term swing trade (likely two weeks out). In the post-market, there’s a move to the upside. Sneak preview: We will likely open higher on November 2nd. #AceofWands #PrincessofCups #9ofSwords #PrincessofWands #4ofWands #XILust #PrinceofCups #5ofCups #8ofWands #6ofCups #XIXTheSun #VITheLovers #VIIIAdjustment #XVITheTower #XXTheAeon #PrincessofDisks
- October 28, 2022 S&P 500 Predictions (RATED)
*Accuracy rating update: 85% or 11/13 predictions correct* Day’s theme : A breakout that is nullified or made irrelevant in some way. Behavior around the high : A fakeout around the high. We’ll expect to break through key resistance but fail to do so and break down through key support. Behavior around the low : There’s a big move down to reach the low. Trade opportunities : An opportunity around a brief high before a notable decline. An opportunity at a day’s low in the afternoon. Possible opportunity at the end of the day. Overview : On October 28, 2022, we move higher out of a low in the pre-market. Around the open, we’ll see a notable drop on a one-day chart within a period of volatility. In the first half hour, there’s a big move to the upside that forms a day’s high. Between roughly 11:00 a.m. and noon, there’s a notable drop from that high followed by an attempt to establish support. Between 1:00 p.m. and 2:00 p.m., there’s a decline to and through a support level. We then move back up and reuse that support level. Between 2:00 p.m. and 3:00 p.m., there’s a trade opportunity around a day’s low. At some point in the last two hours of trading, there’s a rally out of the dip to and through support. This is followed by a return to that support level and a rally off of support along a diagonal trend line. We then break through horizontal resistance to meet a secondary resistance level and then pull back to somewhere between those two price levels. In the last hour, we’ll see three pokes through the same price level followed by a sharp drop. There’s a bit of a decline either at the end of the day or in the post-market, likely to do with an agreement between two leaders. There’s a trade opportunity in the midst of the decline if it occurs at the end of the day instead of overnight. #6ofWands #XIITheHangedMan #5ofCups #3ofSwords #ITheMagus #9ofDisks #10ofWands #0TheFool #4ofDisks #4ofCups #PrinceofWands #AceofCups #VITheLovers #QueenofSwords #AceofDisks #2ofCups
- November 2, 2022 S&P 500 Predictions (RATED)
*Accuracy rating update: 93% or 13/14 predictions correct* Day’s theme : A notable move to the upside that will stand out on a multi-day chart. Behavior around the high : Around the high, we meet a critical resistance level. There’s a trade opportunity around this resistance level. Behavior around the low : There’s a trade opportunity around the low. Trade opportunities : An opportunity to open a call and put spread in the first hour of trading. An opportunity around the high which will be at a resistance level. Overview: Overnight or in the pre-market on November 2nd, we have a big move higher that reaches for a distant resistance level. Right at the open, there’s a critical price level highlighted. There’s an opportunity around this time to position oneself to play both directions with a call and put spread. We’ll have a lot of price movement along a diagonal trend line between 10:00 a.m. and 11:00 a.m. We’ll break through horizontal resistance to meet a secondary resistance, and then we pull back to somewhere between those two price levels. We rotate along support between roughly 11:00 a.m. and noon. This is followed by an unexpected failed attempt to break through key resistance. We then decline into a low with consecutively lower spikes up on the way down. These spikes up will likely meet moving averages as resistance levels. It looks as though we will decline for most of the rest of the day. Around 2:00 p.m., we decline to and through a support level, meet another support level, and then rotate alongside that level. In the last hour, there’s a failed attempt to break through key resistance on a one-day chart, followed by a decline through a key support level on a one-day chart. The day’s low will likely be in the last hour of trading. Right around the close, there’s a fast, sudden move to the upside. In the post-market, we’ll see a sideways fluctuation with a bullish trend that precedes a decline. Sneak preview: A trade opportunity the morning of November 3rd. If we end lower on the 2nd, we’ll open higher on the 3rd, and if we end higher on the 2nd, we’ll open lower on the 3rd. #9ofDisks #PrincessofWands #XVITheTower #8ofWands #XILust #PrincessofSwords #QueenofWands #3ofDisks #5ofCups #5ofWands #5ofDisks #5ofSwords #VIITheChariot #4ofSwords #7ofWands #XTheFortune
- November 4, 2022 S&P 500 Predictions (RATED)
*Accuracy rating update: 100% or 11/11 predictions correct* Day’s theme : A notable move to the upside. Behavior around the high: There’s the beginning of a rally into the high. We then meet a key resistance level and bump along that resistance level for a bit before breaking back down. Behavior around the low: We have a breakout out of the low. Trade opportunities : N/A Overview: On November 4th, there may be something to do with congress or a holding pattern in the pre-market. We’ll then drop through a support level that we recently broke through. In the first hour or so, we’ll see a sharp decline that continues into the afternoon. Between 11:00 a.m. and noon, there’s three pokes through the same price level followed by a drop after the third poke. There’s a bit of a rally along a diagonal trend line midday, however that ends abruptly with a fast, sudden move to the upside. This is followed by a sharp decline through that diagonal trend line with increasing volatility on the way down. We break down through a critical resistance level, likely on more than just a one-day chart. Out of the low, we have a big rally higher. There’s a breakout to the upside starting in that low that takes place roughly between 2:00 p.m. and 3:00 p.m. and continues into the end of the day. At the end of the day, we have a sharp drop right around the close or in the post-market. Sneak preview: A big move to the upside around the open on the 7th. #XIXTheSun #7ofWands #5ofWands #XIIIDeath #VTheHierophant #4ofWands #0TheFool #3ofSwords #KnightofWands #6ofSwords #AceofWands #9ofDisks #XVTheDevil #IXTheHermit #6ofWands #VIIIAdjustment
- S&P500 Forecast for September 2022 (RATED)
*Accuracy rating update: 96% or 56.5/59 predictions correct* Theme: A decline that ends with a fast, sudden move to the upside. This is crossed with at least one period of bullish sideways fluctuation that precedes a decline. For the month of September, we temporarily establish new support around the month’s high. I’m advised that there’s a significant cash-out opportunity there. To reach the month’s low, there will be a notable decline with a breakdown through multiple critical support levels. On the 1st, we have a decline that ends with a sudden move to the upside. There’s also a swing trade opportunity in the midst of this decline around a critical price level with some sideways fluctuations that are in a bearish formation preceding an incline. Around the 2nd, there will be a notable decline that stands out on a one-month chart. On the 6th, we have a move higher through horizontal resistance which we will stay above briefly and then break back down through that same price level. There is one local high, meaning there is a prominent high that stands out on a one-day chart. That high will form when there’s a rally that marks an opportunity to open up a short position to protect against long positions on a one-day chart. On the 7th, we have some cross correlations with both the month’s high and the month’s low, but the correlation is stronger for the month’s high. We will likely see some back and forth volatility here. It looks like there’s a cash out opportunity at the beginning of the day. There may be a day trade opportunity as well. It appears that the trading opportunity has to do with two leaders, which makes me think this is likely a high. Continuing with the 7th, there is a local low on a one-day chart, and out of it will come a rally along a diagonal trend line breaking through horizontal resistance before moving to secondary resistance. It will then break back down to somewhere between those two price levels. I’m advised to buy protection at the end of the day. On the 8th, we have what appears to be the completion of a rally. We may revisit a crest here. There’s a completion of a rally and a swing trade opportunity here involving a sideways fluctuation in a bearish formation that precedes a rally. On the 9th, there is a move out of a notable decline from the bottom of a range to the top of a range. Due to Mercury being in retrograde around this time, there will either be a reversal or a pause in trend. At the end of the day, we have a move higher followed by a decline back down through the same price level. A full moon around this time indicates another opportunity for reversal. Somewhere between the 8th and the 12th we’ll see a notable reversal on a one-month chart. On the 12th, we have a move higher through horizontal resistance. We stay above resistance briefly then break back down to the same price level. It may be the same price level as the 9th if not a bit higher. There’s a local high that forms offering an opportunity to open up a short position. There’s also quite a big decline around the 12th, possibly early in the day. On the 13th, again we have a move higher through a resistance. We stay above resistance briefly before breaking back down. The overall theme for the 13th is a prominent move to the upside that’s matched by an equal move back down. For the 14th, a significant or important price level is highlighted at resistance. There’s one local high that forms there. We should be able to see when the high is forming because we’ll see a lull in volume. There’s also a swing trade opportunity on the 14th involving sideways fluctuations in bearish formation that precede an incline. On the 15th, there is a strong decline into a prominent trough. This trough could be prominent on a one-day chart or even on a one-month chart. On the 16th, there is an indication of a crest, although I don’t believe it to be the month’s high. We’ll also see a notable trough on either a one-day or one-month chart. We may reach a new low and then out of that come to a new high. There’s three criss-crosses back and forth through the same price level confirming a bullish trend. On the 19th, it may continue to rise a bit higher. The overall theme and behavior of the 19th is a fast and sudden move higher that marks the end of a period of volatility. There’s also a swing trade opportunity on the 19th that involves a sideways fluctuation in bearish formation that precedes a rally. Toward the end of the day, there’s a notable move to the upside. On the 20th, it looks like there’ll be a lot of bullish energy. We may turn a resistance level into new support early on. There’s a notable move to the upside midday. Toward the end of the day, we may even turn a second resistance level into new support. There is a swing trade opportunity involving a key technical price level on a multi-day chart. On a one-day chart of the 20th, there will be a surprising new high that forms in the midst of some negative headwinds. Where we’ll expect to move lower we will actually move higher. Between the 21st and the 22nd, it looks as though we have a sideways S-formation, meaning between horizontal resistance and horizontal support we should see a decline to support followed by a rebound back up to resistance. This is then followed by another drop to support. It looks like we go from a crest into another notable trough here. There’s a lot of price movement in the midst of the sideways S-formation and big moves on the 22nd in general. On the 23rd, we’ll see selling from near overbought territory on the RSI. There will also be two local lows on a one-day chart. One low will involve a rally out of the low along a diagonal trendline breaking through horizontal resistance to meet a secondary resistance and then fall back to somewhere between those price levels. The other low will be a high of some sort that will not be revisited on a one-day chart. Over the weekend, we have a new moon which is another reversal indication. On the 26th, we have three pokes through the same price level. On the third poke, there’s a notable decline on a one-day chart. We also have a swing trade opportunity involving sideways fluctuations in bearish formation preceding a rally. There is one local high on the 26th involving an important price level at resistance. It looks like we have a poke at that price level early in the day and one to two pokes at the end of the day if not overnight on the 27th. We’ll also see a notable rally over the 27th. In the midst of that rally, I’d advise opening up some protection. Protection is advised because come the next significant decline on a multi-day chart, we’re going to be significantly lower than the price level at the high on the 27th. On the 28th, we have a rally that breaks down with a fast, sudden move to the upside and then breaks through a diagonal trendline with increasing volatility on the way down. It looks like we have lower prices on the 29th, revisiting some past problems. There’s also a flight to safety. On the 30th, we attempt to establish support at a low. It looks like there is also a notable fakeout at that low on the 30th. This is important to note because it’s one of the three significant fakeouts that we identified for 2022. There is a year’s low in September and it looks like there is another low late in September. With this low at the end of September there are significant trade opportunities. #PrincessofWands #AceofDisks #5ofWands #0TheFool #AceofCups #PrinceofCups #2ofCups #PrincessofDisks #4ofWands #9ofWands #3ofCups #XIVArt #4ofSwords #XIIIDeath #3ofWands #8ofCups #IVTheEmperor #KnightofCups #6ofSwords #QueenofWands #3ofDisks #2ofSwords #IIITheEmpress #VIITheChariot #7ofWands #7ofSwords #KnightofSwords #XVIITheStar #6ofDisks #QueenofCups #10ofCups #3ofSwords #UnicursalHexigram #KnightofWands #IXTheHermit #4ofDisks #XVTheDevil #10ofSwords #7ofCups
- November 7, 2022 S&P 500 Predictions (RATED)
*Accuracy rating update: 91% or 10/11 predictions correct* Day’s theme : A prominent move higher, however this is nullified and counteracted. Behavior around the high: There’s quite a bit of volatility around the high. We’ll also meet the high at a key resistance level on a multi-day chart. Behavior around the low: The low is in close proximity to a move higher through a resistance level. We stay above that resistance level briefly and then break back down through that same price level. Trade opportunities : An opportunity in the midst of a low between around 11:00 a.m. Overview: On November 7th, we revisit a crest in the midst of some erratic behavior in the pre-market. There’s also a notable decline on a one-day chart in the pre-market or right around the open. We’ll have a day’s low in the early morning and a sideways S-formation between a resistance and support level. We attempt to establish support at a minor crest or peak between 10:00 a.m. and 11:00 a.m. We revisit the low from early in the morning around this time. There’s a trade opportunity in the midst of that low. There’s a sharp decline midday after an unexpected failed attempt to break through a key resistance level on a one-day chart. We’ll be range bound with a move to the upside between noon and 3:00 p.m. Somewhere in that timeframe there’s a high and three pokes through the same price level at the upper end of the range. We’ll then see a sharp drop after that third poke and decline pretty hard in the last two hours of trading. We’ll continue to move to the downside either around the close or overnight. #10ofDisks #2ofWands #PrinceofSwords #XIIIDeath #6ofCups #4ofDisks #QueenofCups #4ofCups #5ofCups #10ofWands #3ofSwords #UnicursalHexigram #XXITheUniverse #9ofSwords #2ofSwords #QueenofCups #3ofCups #IIITheEmpress
- November 8, 2022 S&P 500 Predictions (RATED)
*Accuracy rating update: 100% or 14/14 predictions correct* Day’s theme : A failed attempt to break through key resistance followed by a decline through key support Behavior around the high: A notable drop, possibly to a day’s low off of the high. There’s a significant trade opportunity at the day’s high. Behavior around the low: A trade opportunity at the day’s low. Trade opportunities : Advised to trade around erratic behavior back and forth through the same price level. Overview: On November 8th, we’ll likely open up a bit higher than we closed on the previous day. In the pre-market, we have a notable move to the upside out of the first low for the day where we test resistance. We have a critical resistance level that’s highlighted around the open. We then fall from that price level to a support level and then rotate sideways along support within the first half hour. The high for the day is somewhere around 11:00 a.m. Around noon, we come back to the price level that we previously tested in the pre-market. It looks like we fail to break through that price level and then move to the downside through a critical support level. We fall to a day’s low somewhere between 2:00 p.m. and 3:15 p.m. We’ll then see a fast, sudden move higher that marks the end of that decline. We then have three criss-crosses back and forth through the same price level. There’s an important resistance level highlighted around the close. At some point in the post-market, we turn that resistance level into support and then rotate sideways along that price level before a fast, sudden move higher. Sneak preview: An agreement between two leaders is highlighted on the following day. #5ofSwords #6ofCups #XIIIDeath #2ofSwords #7ofSwords #5ofDisks #IVTheEmperor #5ofCups #UnicursalHexigram #XXITheUniverse #AceofDisks #KnightofCups #3ofWands #KnightofDisks #4ofSwords #0TheFool #VITheLovers