Search Results
Search this site
2352 results found with an empty search
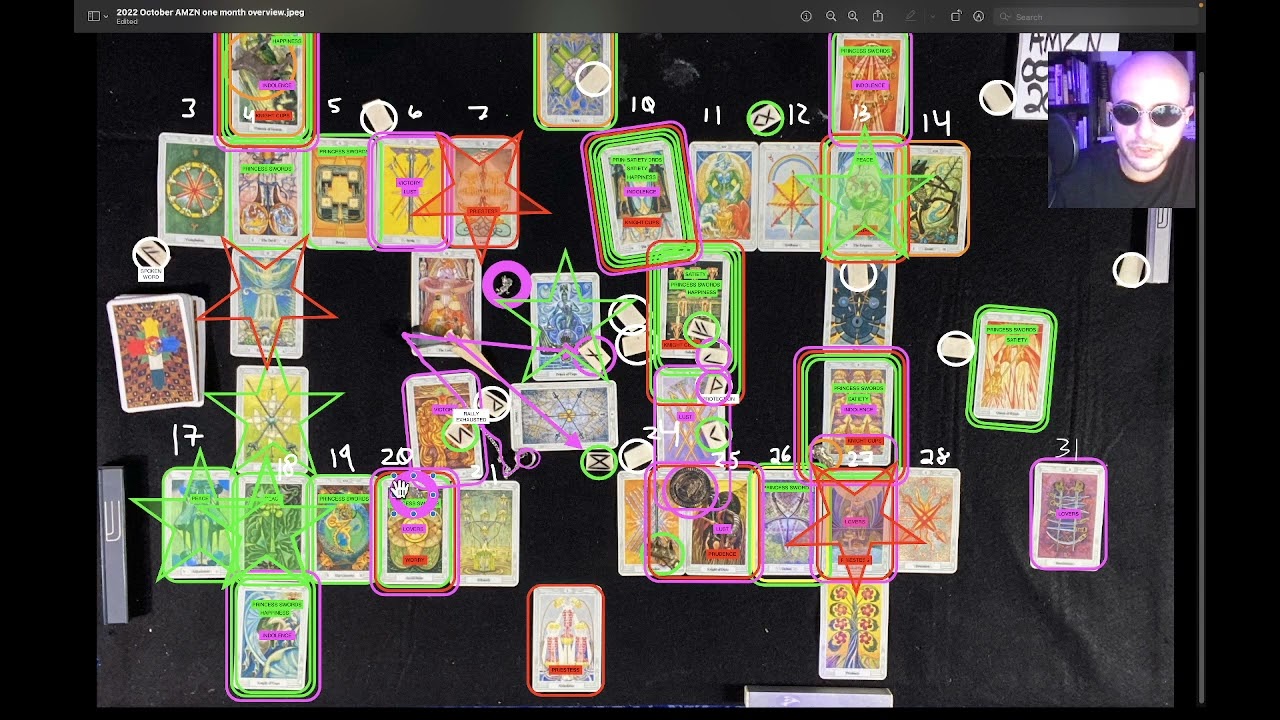
- Amazon ($AMZN) October 2022 Predictions
Month’s theme : A decline off of a significant high on a multi-day chart. Behavior around the high: A critical price level is highlighted at the high. There will also be a lull in volatility and volume around the high. Behavior around the low: Around the low, we have a move higher through a resistance level. We stay above that price level briefly and then break back down. The low is likely within close proximity to a minor crest. Trade opportunities : Two opportunities on the 6th. One involves a breakout on a one-day chart, and the other involves a big move to the upside on a one-day chart that reaches for a distant resistance level. There’s a swing trade opportunity on the 10th. Around the 25th, there’s a swing trade opportunity involving a big move to the upside. On the 27th, there’s a swing trade opportunity involving an agreement between two leaders. On the 31st, there’s a swing trade opportunity in the midst of multiple failed attempts to break through key resistance. Overview: Week One (10/3-10/7): On October 3rd, we likely have the completion of a bullish trend. There appears to be a notable amount of price movement on the 4th and possibly on the 5th. There’s also an intentional fake out or false triggering of an indicator on the 4th. On the 5th, we attempt to establish support, and there’s a crest toward the end of the day. On the 6th, we have a decline through a resistance level, and as we fall we have consecutively lower spikes up on the way down. There are two trade opportunities on the 6th, possibly a day trade opportunity. One involves a breakout on a one-day chart, and the other involves a big move to the upside on a one-day chart that reaches for a distant resistance level. On the 7th, we’ll likely have a first low for the month. Week Two (10/10-10/14): On the 10th, we’ll have three local highs, one local low, and a swing trade opportunity. We’ll have a brief high before a notable decline. On the 11th, there’s a prominent move higher that will stand out on a multi-day chart, followed by a full retracement of that move back down. On the 12th, we’ll have a higher high than we did on the 11th. There’s a fast, sudden move to the upside on the 13th. We’ll also see a rally into a month’s high on the 13th after bearish price swings. There will be a lull in volume around that high. We then decline out of the high, increasing with momentum as we move forward. There’s a prominent trough that forms on the 14th. Week Three (10/17-10/21) On the 17th, we have a move higher out of oversold territory. We’ll reach a month’s high around that move to the upside. On the 18th, there will likely be a month’s crest. We’ll see three pokes through the same price level followed by a sharp decline. On the 19th, there’s a sharp decline. The high on the 19th offers an opportunity to position oneself in both directions. On the 20th, we have an important support level that forms after a sharp decline. I’m advised to open up protection midday. On the 21st, we’ll see a decline to and through a support level. We move sideways along that support level and then decline further. It looks like we have a pretty sharp decline over the weekend. Week Four (10/24-10/31) On the 24th, we’re bound by a range on a multi-day chart. There’s a rally that starts mid-afternoon. On the 25th, there’s a cash out opportunity at the end of the day or early in the morning. There’s also a swing trade opportunity on the 25th involving a big move to the upside. We’ll then see some sideways rotation along a key support level on a multi-day chart followed by a fast, sudden move to the upside that marks the end of that period of sideways rotation. On the 26th, there’s a failed attempt to break through key resistance and an opportunity to position oneself in both directions. There’s also a significant technical price level for the month that’s highlighted around this time. We’ll then see a decline through key resistance followed by a decline through key support. There will likely be another month’s low on the 27th. There’s a trade opportunity on the 27th involving an agreement between two leaders. On the 28th, we have bullish price swings. On the 31st, there’s another swing trade opportunity in the midst of multiple failed attempts to break through key resistance. Sneak preview: In November, we’ll see a rally along a diagonal trend line that breaks through horizontal resistance, meets a secondary resistance, and then dips back to somewhere between those two price levels. We’ll likely decline into November before we turn back around. #PrincessofSwords #4ofSwords #10ofCups #4ofWands #XVTheDevil #4ofDisks #5ofWands #4ofCups #XVIIITheMoon #XIVArt #8ofWands #IIITheEmpress #XIIIDeath #IITheUniverse #VITheLovers #PrinceofCups #8ofCups #5ofDisks #QueenofWands #2ofSwords #XILust #6ofSwords #6ofWands #9ofCups #VIIIAdjustment #3ofSwords #XXITheUniverse #AceofDisks #7ofCups #10ofWands #KnightofDisks #5ofSwords #QueenofCups #2ofWands #8ofSwords #KnightofCups #3ofCups #8ofDisks
- SHIB Coin September 2022 Predictions
Month’s theme : Sideways rotation along a key support level that ends with a fast, sudden move to the upside. We’ll also see a lot of sideways movement throughout the month. Behavior around the high: A failed attempt to break through a key resistance level, followed by a decline through a key support level on a one-month chart. Behavior around the low: A higher level and a lower level around the low in the near future. Trade opportunities : There’s a swing trade opportunity on the 1st involving an opportunity to open up a long position in the midst of a decline. Around the 2nd, there’s a trade opportunity that involves a sudden move higher marking the end of a period of volatility. Around the 3rd, there’s a swing trade opportunity around a notable drop. Around the 4th, there’s a trade opportunity around where we begin to sell off. Around the 5th, there’s some deception around a low and a swing trade opportunity involving a fast, sudden move higher marking the end of a period of volatility. There are two trade opportunities around the 9th: one involves a decline that marks an opportunity to open up a long position. The other involves a fast, sudden move higher marking the end of a period of volatility. There’s another swing trade opportunity around the 10th that involves a fast, sudden move higher marking the end of a period of volatility. Around the 12th, there’s a trade opportunity involving a decline that offers an opportunity to open up a long position. Around the 18th, there’s a swing trade opportunity in the midst of multiple failed attempts to break through key resistance. Around the 19th, there’s a swing trade opportunity in the midst of volatility that ends with a fast, sudden move to the upside. Around the 20th, there’s a swing trade opportunity in the midst of a decline that offers an opportunity to open up a long position. Around the 21st, there’s an opportunity to open up a long position in the midst of a low. Around the 28th, there’s an opportunity to open up a long position in the midst of a decline. Overview: Week One (09/1-09/8) Around September 1st, we have three pokes through the same price level followed by a sharp decline after that third poke. Around the 2nd, it looks like there may be a bit of a move higher followed by a full retracement back down to where the move higher started. We’ll see a prominent high on September 3rd. We’ll also hit an important resistance level and have an unexpected move upward on the 3rd. On the 4th, that previous unexpected move upward is followed by a decline from overbought territory. There’s a decline down to a month’s first low on the 4th as well. There are swing trade opportunities from the 1st through the 5th (see trade opportunities at the top). On the 6th, we have a rally that increases with momentum moving into the end of the day. We reach a key resistance level around the 7th and fall pretty sharply into a minor trough for the month. On the 8th, we open up a bit higher, however we’ll see another low for the month after we hit resistance again and continue to decline. Week Two (09/9-09/16) On September 9th, we’ll see two local highs, meaning two highs or crests that stand out on a one-day chart. One high involves sideways rotation along a support level with increasing bullish sentiment and momentum as we move forward in time. The other high will be around a sudden dip within a period of volatility. There are two trade opportunities around the 9th: one involves a decline that marks an opportunity to open up a long position. The other involves a fast, sudden move higher marking the end of a period of volatility. There’s another swing trade opportunity around the 10th that involves a fast, sudden move higher marking the end of a period of volatility. There will also be a decline through multiple support levels on the 10th. On the 11th, we have a key support level highlighted, and we may be attempting to establish a new support level in the midst of a rally higher. On the 12th, we revisit a support level when we have a sudden dip within a period of sideways rotation. There’s also a swing trade opportunity on the 12th involving a decline that offers an opportunity to open up a long position. There’s a key resistance level highlighted on the 12th and the 13th. Somewhere around the 12th or 13th, there’s a bit of a move to the upside. That move to the upside is halted when we have a decline through a key critical support level to meet another month’s low on the 13th. Out of the low on the 13th, there will be a rally along a diagonal trend line breaking through horizontal resistance to meet a secondary resistance level. We’ll then dip back to somewhere between those two price levels. On the 14th, there’s a rally into a notable move higher that will stand out on a one-month chart. We also have a key support level highlighted as well as a local high and a local low. On the 15th, we have another prominent trough for the month. We decline through multiple support levels after meeting a resistance level. On the 16th, we have a critical technical price level and possibly a notable crest. Week Three (09/17-09/24) On the 17th, we have a move higher through resistance level followed by a decline back down through that same price level shortly thereafter. Around the 18th, there’s a swing trade opportunity in the midst of multiple failed attempts to break through key resistance. There’s also a bit of volatility on the 18th that ends with a fast, sudden move to the upside. Around the 19th, there’s another swing trade opportunity in the midst of volatility that ends with a fast, sudden move to the upside. On the 20th, there’s a fast, sudden move higher. One local low will form when out of a decline we have a move from the bottom of a range to the top of a range. There’s also a swing trade opportunity in the midst of a decline on the 20th that offers an opportunity to open up a long position. We’ll see a month’s low around the 20th or 21st. There’s also another month’s low on the 21st and an opportunity here to open up a long position for the coming high we should see in early October. On the 22nd, we have two local lows and one local high in the midst of a prominent decline on a one-day chart. One local low will form when out of a decline we have a move from the bottom of a range to the top of a range. The other local low will involve some erratic behavior back and forth through the same price level. The local high will involve a sudden dip out of the high which will form within a period of volatility. It looks like we have a failed attempt to establish support on the 23rd. There’s some trickiness on the 23rd, possibly an intentional fake out of some sort. On the 24th, we have a U-shaped dip. From that price level, we attempt to establish support. We move down to a low and around that low there’s a move higher through a resistance level on a one-day chart, and then we break back down through that price level shortly thereafter. Week Four (09/25-09/30) On the 25th, we have three local highs. It looks as though there will be a pretty prominent crest that forms here. One local high forms in the midst of some sideways bullish price swings. Another high forms when we have three criss-crosses back and forth through the same price level, confirming a bullish trend. The third local high forms when we have a period of volatility that ends with a sudden dip. I’m advised to open up some protection in the midst of a rally on the 25th. On the 26th, we hit a key resistance level. There are sideways fluctuations along support throughout the day with equal amounts of bulls and bears. There’s also a prominent trough for the month that stands out on the 26th. There’s likely a prominent trough around the 27th. On the 27th, out of a decline there’s a fast, sudden move higher that marks the end of that period of decline, and from there we meet key resistance again. On the 28th, we have a prominent move higher that is matched by a full retracement back down to where the move higher started. There’s also an opportunity to open up a long position in the midst of a decline. On the 29th, there’s one local low that involves a move higher through resistance on a one-day chart and then breaking back down through that same price level shortly thereafter. There’s another prominent trough for the month on the 30th after we hit a resistance level. There’s an attempt to establish support on the 30th as well. Sneak preview: For October, an important price level is highlighted, likely near the crest on September 16th. #2ofWands #5ofSwords #PrinceofDisks #3ofSwords #VTheHierophant #XVIITheStar #10ofCups #VITheLovers #PrinceofWands #XXITheUniverse #XVIIITheMoon #IIITheEmpress #7ofDisks #XIXTheSun #QueenofDisks #XIITheHangedMan #AceofWands #8ofCups #3ofCups #PrincessofCups #KnightofDisks #0TheFool #6ofCups #2ofSwords #QueenofSwords #KnightofSwords #AceofSwords #9ofCups #UnicursalHexigram #3ofWands #4ofSwords #2ofCups #8ofSwords #9ofSwords #8ofWands #PrinceofCups #AceofCups #8ofDisks #IITheUniverse #4ofWands #2ofDisks #KnightofCups #XIVArt #VIITheChariot #4ofDisks #QueenofWands #PrincessofSwords #9ofWands
- October 27, 2022 S&P 500 Predictions (RATED)
*Accuracy rating update: 92% or 11/12 predictions correct* Day’s theme : An attempt to establish new support at a high. Trade opportunities : There's an opportunity to buy calls around the open and sell them between 2:00 p.m. and 3:00 p.m. Overview : On October 27, 2022, we have sideways rotation with a bullish trend that precedes a decline in the pre-market. Right around the open, there’s a decline that offers an opportunity to buy calls, however this opportunity is brief. Even in the face of seemingly overwhelming headwinds, that decline is followed by a move to the upside around 9:45 a.m. There’s an opportunity to open up a long position as a rally commences between 10:00 a.m. and 11:00 a.m. This rally continues between 11:00 a.m. and noon. The rally is cut short by being range bound around midday and then we have a bit of a decline from roughly 1:00 p.m. to 2:00 p.m. We’ll then see a prominent trough around 2:00 p.m. Out of that trough, there’s an unexpected and prominent move to the upside. There’s a cash out opportunity to sell the calls purchased earlier in the day between 2:00 p.m. and 3:00 p.m. We’ll see a completion of a rally around 3:00 p.m. and a lot of movement toward the close. There’s a big price movement in the last hour of trading. In the post-market, we’ll see a U-shaped dip. Sneak preview : A good trade on the 28th in the midst of sideways S-shaped rotation between horizontal resistance and support. #4ofDisks #ITheMagus #2ofDisks #4ofCups #VIITheChariot #PrincessofCups #XIXTheSun #10ofDisks #10ofWands #XIIIDeath #PrincessofDisks #4ofWands #IITheUniverse #7ofSwords #4ofSwords #QueenofCups
- October 25, 2022 S&P 500 Predictions (RATED)
*Accuracy rating update: 100% or 11/11 predictions correct* Day’s theme : A notable completion of a rally marked by a sharp decline through a critical support level. I’m advised to be cautious of a lot of price movement throughout the day or at the end of the day. Behavior around the high : Out of the high, we have sideways fluctuations with a bearish trend that precede a rally. Behavior around the low : Moving into the low, we’ll have selling from overbought territory on the RSI. Trade opportunities : A trade opportunity in the first hour, although I advise being cautious trading here. Overview : On October 25, 2022, we have a notable and unexpected move to the upside in the pre-market. Around the open, we have a move higher through a resistance level, followed by a decline back down through that same price level shortly thereafter. Although there is a trade opportunity around that price movement, I’m advised to avoid risk and be cautious in the first half hour. Around 10:00 a.m., there’s a rally that commences off of a trough, however that rally doesn’t last very long. Around noon, we’ll see a fast sudden move to the upside, followed by a break down through a diagonal trend line that we’re rallying along with increasing volatility on the way down. Around 1:00 p.m. to 2:00 p.m., we have a fast, sudden move to the upside during a period of volatility that marks the day’s high. Since this is during a period of volatility, there should be a bit of a retracement. Around 2:00 p.m. to 3:00 p.m., we have a move to the upside that will stand out on a one-day chart. The rally continues into the last hour of trading. We then break down toward the end of the day or in the post-market. Sneak preview : A gap down on the 26th. #XIITheHangedMan #6ofSwords #IIITheEmpress #XIVArt #XVIITheStar #8ofDisks #IXTheHermit #7ofCups #8ofSwords #KnightofSwords #10ofDisks #PrincessofWands #XVTheDevil #2ofCups #10ofCups #IITheUniverse
- October 21, 2022 S&P 500 Predictions (RATED)
*Accuracy rating update: 100% or 12/12 predictions correct* Day’s theme : We’ll revisit past problems in a decline through a key support level, however this decline is nullified, meaning it’s made irrelevant by other behavior throughout the day. Behavior around the high : We’ll have a rally into a diagonal trend line and break through horizontal resistance before meeting a secondary resistance. We then pull back to somewhere between those two price levels to form the high for the day. Behavior around the low : We’ll see a nullified low, likely in the form of a sharp drop followed by a turnaround. Trade opportunities : An opportunity to open up a long position around the open. Another opportunity to trade in the midst of a low, likely around midday. Overview : On October 21, 2022, we’ll be in the midst of a decline in the pre-market. Right around the open, we have an opportunity to open up a long position. We’ll see a big move to the upside pushing the upper end of a range. I’m looking for a failed attempt to break through key resistance on a one-day chart to cash out of that long position, likely around 9:40 a.m. Around 9:45 a.m., we’ll have a low or trough. Roughly between 10:00 a.m. and 11:00 a.m., we’ll see three pokes through a resistance level followed by a sharp decline after that third poke. Between 11:00 a.m. and noon, we continue declining, likely into a low. This is followed by a big move to the upside that reaches for distant resistance, so I’m looking to trade in the midst of that low, likely around midday. That move to the upside is followed by a decline back down to a support level. We then rotate alongside that support level for a bit. Toward the end of the day, likely around 2:00 p.m. or 3:00 p.m., we have a decline from overbought territory on the RSI off of a crest or a high. We’ll see a high at the end of the day and a decline during after hours or overnight. Sneak preview : It looks like we’ll be opening lower on the 22nd. #IXTheHermit #5ofWands #QueenofWands #2ofWands #PrincessofCups #5ofSwords #3ofSwords #AceofCups #XILust #5ofDisks #10ofCups #0TheFool #PrinceofDisks #XXTheAeon #2ofCups #IIITheEmpress
- October 20, 2022 S&P 500 Predictions (RATED)
*Accuracy rating update: 100% or 11/11 predictions correct* Day’s theme : A prominent move higher followed by a full retracement of that move. I’m advised to avoid risk on this day. Behavior around the high : An important price level at the high. Behavior around the low : A notable decline through key support, likely on a multi-day chart but definitely on a one-day chart. Trade opportunities : I’m advised to trade around a big move to the upside. There’s also a trade opportunity to open up a long position in the midst of a decline. Overview: In the pre-market on October 20, 2022, we have a failed attempt to break through a key resistance level, followed by a decline through a key support level. Right around the open, we’re range bound, likely to the downside. We have a big move to the upside followed by a retracement of that move back down. There’s a completion of a rally and congress is highlighted somewhere between 10 a.m. and 11:00 a.m. We then have a decline off of a significant high midday. In the midst of the decline off of that crest, there’s an opportunity to open up a long position. Roughly between 2:00 p.m. and 3:00 p.m., we move sideways along key support on a one-day chart. Somewhere between 3:00 p.m. and 4:00 p.m., we move higher through key resistance on a one-day chart. There’s possibly a notable peak for the day here. This is followed by a breakdown through that same resistance level. Toward the end of the day, we revisit what was recently a past opportunity at a support level. #XIVArt #XXTheAeon #6ofSwords #10ofCups #5ofSwords #XIXTheSun #4ofWands #VTheHierophant #AceofCups #2ofDisks #3ofCups #QueenofDisks #XTheFortune #10ofWands #IXTheHermit #9ofDisks
- October 19, 2022 S&P 500 Predictions (RATED)
*Accuracy rating update: 100% or 9/9 predictions correct* Day’s theme : A notable fake out on a one-month chart midday. Behavior around the high : A notable decline off of the high that will stand out on a one-day chart. Behavior around the low : Multiple failed attempts to break through key resistance around the low. Trade opportunities : There’s an opportunity to open up puts midday. Overview : On October 19, 2022, there’s a male ruler of nations highlighted early in the day. Right at the open, we’ll see a critical resistance level. In the first half hour, we sell from an overbought crest or peak down to a support level. We’ll likely meet that support level around 10:00 a.m. Between roughly 10:00 a.m. and 11:00 a.m., we’ll see some erratic back and forth behavior through the same price level. Between roughly 11:00 a.m. and noon, there’s a move to the upside out of a decline. We will likely hit a day’s high again somewhere in the midst of this erratic behavior. I would likely open up puts around this time and then position myself for both directions midday. Later in the day, we’ll see quite a bit of bearish behavior. There’s a decline through multiple support levels and a day’s low at the end of the day. Sneak preview : A notable gap up on the 20th. #XVTheDevil #XVITheTower #AceofCups #XIITheHangedMan #IVTheEmperor #PrinceofDisks #6ofCups #9ofWands #PrincessofSwords #10ofSwords #QueenofDisks #ITheMagus #IXTheHermit #10ofCups #8ofSwords #XILust
- August 29, 2022 S&P 500 Predictions (RATED)
*Accuracy rating update: 100% or 16/16 predictions correct* Day’s theme : Sideways rotation along a support level, a move higher to reach the closest resistance, and a movement back down to move sideways along that support again. Behavior around the high: An important price level around the high. Behavior around the low: A cash-out opportunity around the low. Trade opportunities : An opportunity at a resistance level around midday. Overview: On August 29th, there’s a breakout of some sort in the pre-market. Right around the open, there’s a day’s high, but this is quickly followed by a decline through multiple support levels, roughly around 10:00 a.m. The low for the day is highlighted roughly around this time. There’s a cash-out opportunity in the midst of the day’s trough or low, likely around 11:15 a.m. We hit resistance midday in the midst of a fast, sudden move higher that marks the end of a period of decline. There’s a trade opportunity around this resistance level. We have another day’s low or trough after we meet resistance. We’ll break down through a support level, meet a secondary support, and then move sideways along that support between roughly 1:00 p.m. and 2:00 p.m. There’s then a fast, sudden move higher off of that midday support level, likely around 1:30 p.m. or 1:45 p.m. We’ll then see a notable reversal on a one-day chart marked by a prominent crest or high around 3:00 p.m. There will be some sideways rotation with a fast, sudden move higher marking the end of that period of sideways rotation. Right around the close, we have some sideways price swings with a bullish trend, possibly breaking through horizontal resistance to meet a secondary resistance. There’s three pokes through the same price level at a day’s high right around the close or in the post-market. After the third poke, there’s a sharp decline, possibly into another prominent trough for the day. Sneak preview: An important range is highlighted, however it is somehow nullified or made irrelevant. #3ofDisks #XVIIITheMoon #4ofSwords #2ofWands #6ofWands #PrinceofCups #VITheLovers #4ofDisks #KnightofCups #5ofDisks #XTheFortune #KnightofDisks #3ofSwords #7ofDisks #PrincessofDisks #10ofWands
- August 30, 2022 S&P 500 Predictions (RATED)
*Accuracy rating update: 100% or 10/10 predictions correct* Day’s theme : A prominent move to the upside from the bottom of a range to the top of a range. Behavior around the high: Three pokes through the same price level at the high toward the end of the day. Behavior around the low: N/A Trade opportunities : An opportunity in the midst of a big move to the upside around midday. Overview: On August 30th, there will be a drop either overnight or first thing in the pre-market. Somewhere between 10:00 a.m. and noon, we move higher through a resistance level, stay there briefly, and then break back down through that same price level. We then break down to and through a support level and then move back up to reuse that support level. I’m advised to be cautious around midday, however there may be temptation to not be cautious. After that midday caution point, we have a move that stands out on a one-day chart, and a trade opportunity in the midst of that move to the upside. This is then followed by a notable decline. In the last hour of the day, we move up and out of that decline in the midst of some seemingly overwhelming headwinds. We then rotate sideways along a price level right around the close. There’s a day’s low in the post-market. There’s also some volatility that increases as we move forward in time in the post-market. Sneak preview: There’s a rally that ends with a fast, sudden move higher, followed by a breakdown through a diagonal trend line with increasing volatility on the way down on the 31st. #9ofDisks #5ofWands #3ofCups #2ofDisks #3ofSwords #4ofSwords #7ofCups #4ofCups #8ofDisks #ITheMagus #XXITheUniverse #7ofSwords #PrinceofSwords #3ofDisks #9ofCups #KnightofWands
- August 31, 2022 S&P 500 Predictions (RATED)
*Accuracy rating update: 100% or 10/10 predictions correct* Day’s theme : A notable reversal on a one-day chart. We'll also likely see a month's low. Behavior around the high: A rally along a diagonal trend line that breaks through horizontal resistance and meets a secondary resistance level. We then drop down to somewhere between those two resistance levels. Behavior around the low: A fake out or a big move to the upside around the low. There will be a lot of volatility into the low or coming out of the low. Trade opportunities : There’s a trade opportunity right around the open when we move higher through a resistance level, stay there briefly, and then break back down through that same price level. I’m advised to open up some protection in the midst of a big move out of the day’s low in the early afternoon. Overview: On August 31st, we have a move higher in the pre-market turning resistance into a new support level. There’s a trade opportunity right around the open when we move higher through resistance, stay there briefly, and then break back down through that same price level. We then meet a day’s high around this time. There’s a sideways S-formation between horizontal resistance and support that takes place after that day’s high is met. There’s a big move out of a day’s low and a fake out in the midst of the low in the early afternoon. I’m advised to open up some protection around this time because this will be followed by a big move to the downside. Between roughly 11:00 a.m. and noon, there’s a big move to the upside that reaches for distant resistance, followed by a sharp drop midday or early afternoon. We’ll then see a big move to the upside between roughly 1:30 p.m. and 3:00 p.m., and this is followed by a revisiting of past problems and a big move to the downside. Congress may be highlighted right around the close, and an agreement between two leaders or a merger of some kind is also highlighted right around the close or in the post-market. Sneak preview: We have a failed attempt to break through key resistance followed by a decline through a key support level on September 1st. It also looks like we’ll have a higher price point than we do today. #XTheFortune #IITheUniverse #QueenofWands #VTheHierophant #6ofDisks #IVTheEmperor #QueenofCups #XILust #0TheFool #XVTheDevil #9ofWands #IXTheHermit #VITheLovers #2ofCups #PrinceofSwords #5ofCups
- S&P 500 Forecast for Friday, December 31, 2021
Theme: Big push to the upside with some retracement, an upside-down U-shape. Around the Low: Big push to upside off of low, but it is nullified. Likely this push higher will be cancelled out. Around the High: Close proximity to opportunity to open long positions. Break down through two support levels off of the high, bounce around, and break down further. Overview: The theme card correlates to the pre-market, there is a high correlation with the opening and first half hour card. Around the open we have a breaking down along a diagonal trend line and volatility picks up. There is an opportunity in that decline to open long positions, and then there is a big push higher to reach a high around 9:45am. We have a trade opportunity again, in the midst of a decline. This will be in the 10am to 11am hour, and an important price level is highlighted. There is a big push to the upside again between 11am and 1pm, and both of those hours are correlated to the theme. 11am to noon will come with a big push to the upside, with a U-shaped dip near the intersection of two perpendicular diagonal trend lines. We have a push out of a decline and another opportunity to open long positions around 1pm to 2pm. There is a crest around 1:40pm and another one around 2:45pm-ish. In the 2pm to 3pm hour, there is a decline through multiple support levels. There are wild swings in the last hour, and it also marks a trade opportunity that highlights a male ruler. Around the close, we have a big push higher and a reversal, and this will take place in overbought territory on the RSI. There will be a sell-off that takes us into the pre-market. Looking to Tomorrow: Big move higher, something happens that incites a rally, although it may not hold. #AceofWands #PrincessofCups #IVTheEmperor #7ofCups #2ofCups #10ofDisks #XXTheAeon #4ofSwords #XIXTheSun #IITheUniverse #9ofWands #9ofSwords #2ofWands #10ofCups #KnightofWands #XVIITheStar #PrinceofWands #SunInCapricorn #MoonInSagittarius #4thQuarterMoon #4thQuarterMoonInSagittarius #MercuryInCapricorn #MercuryDirect #MercuryDirectInCapricorn #VenusInCapricorn #VenusRetrograde #VenusRetrogradeInCapricorn #MarsInSagittarius #MarsDirect #MarsDirectInSagittarius #SaturnInAquarius #SaturnDirect #SaturnDirectInAquarius #JupiterInPisces #JupiterDirect #JupiterDirectInPisces #NeptuneInPisces #NeptuneDirect #NeptuneDirectInPisces #UranusInTaurus #UranusRetrograde #UranusRetrogradeInTaurus #PlutoInCapricorn #PlutoDirect #PlutoDirectInCapricorn #ChironDirect #ChironInAries #ChironDirectInAries #MoonSagittariusTrineChironAries @7:51am est. #MoonSagittariusQuincunxUranusTaurus @11:47am est. #MoonSagittariusSextileSaturnAquarius @1:15pm est. #MoonSagittariusConjunctMarsSagittarius @3:01pm est. #ThemeOfDayCard #HighCard #LowCard #FollowingDayCard #TradeCard #OpenCard #CloseCard # #Gap #Open #Close #_______%Accuracy #Friday #December #DailySpread #DayTrading #1DayChart #S&P #Tarot #traders #FinancialMarkets #SPX #StandardAndPoors #Stockmarket #EsotericAnalysis #StockMarketPrediction #StockMarketForecast #2020Forecast #Precognition #S&P500 #2020stockmarket #BeatTheMarket #DayTradingGuidance #TarotAndStockMarket #DayTrading #PatternTrading #SwingTrading #StockMarketPsychic #S&P
- S&P 500 Forecast for Thursday, December 30, 2021
Theme: Multiple false highs or lows, something very tricky. Decline through multiple support levels and the high will not be revisited in the reading. High and the low will be close to each other. Around the Low: Lows will be close to the highs, breakdown in volatility and notable drops from highs. Overview: We open up at a day’s high. We are at a notable price level in the pre-market and then we drop sharply after a failed attempt to break resistance. Right at the open we drop as many as 9 support levels. There’s wild swings around the high between the open and roughly 11am. We have a selling from a peak and come back down between 11am and noon. There are multiple failed attempts to break resistance between noon and 1pm. There is an attempt to establish or re-establish support between 1pm and 2pm. There is a definite peak or high around 12:45pm. Between 2pm and 3pm there is a big push to the upside, and we have a correlation to Theme card in the last hour. The big push higher is met with a flight to safety and a sharp decline through multiple support levels around the close. There is an opportunity to cash in around the close. Looking to Tomorrow: Wild swings and a sharp dip within them. #8ofCups #8ofDisks #IIITheEmpress #XVITheTower #10ofSwords #6ofSwords #5ofSwords #2ofWands #3ofCups #8ofSwords #4ofDisks #XVIITheStar #IXTheHermit #PrincessofDisks #9ofSwords #KnightofWands #XVIIITheMoon #SunInCapricorn #MoonInScorpio #4thQuarterMoon #4thQuarterMoonInScorpio #MoonInSagittarius #4thQuarterMoonInSagittarius #MercuryInCapricorn #MercuryDirect #MercuryDirectInCapricorn #VenusInCapricorn #VenusRetrograde #VenusRetrogradeInCapricorn #MarsInSagittarius #MarsDirect #MarsDirectInSagittarius #SaturnInAquarius #SaturnDirect #SaturnDirectInAquarius #JupiterInPisces #JupiterDirect #JupiterDirectInPisces #NeptuneInPisces #NeptuneDirect #NeptuneDirectInPisces #UranusInTaurus #UranusRetrograde #UranusRetrogradeInTaurus #PlutoInCapricorn #PlutoDirect #PlutoDirectInCapricorn #ChironDirect #ChironInAries #ChironDirectInAries #MoonScorpioTrineNeptunePisces @2:51am est. #MercuryCapricornConjunctPlutoCapricorn @4:54am est. #MoonScorpioSextileVenusCapricorn @8:19am est. #MoonScorpioSextilePlutoCapricorn @11:27am est. #MoonScorpioSextileMercuryCapriicorn @12:10pm est. #MoonEntersSagittarius @6:08pm est. #MoonSagittariusSquareJupiterPisces @6:42pm est. #ThemeOfDayCard #HighCard #LowCard #FollowingDayCard #TradeCard #OpenCard #CloseCard # #Gap #Open #Close #_______%Accuracy #Thursday #December #DailySpread #DayTrading #1DayChart #S&P #Tarot #traders #FinancialMarkets #SPX #StandardAndPoors #Stockmarket #EsotericAnalysis #StockMarketPrediction #StockMarketForecast #2020Forecast #Precognition #S&P500 #2020stockmarket #BeatTheMarket #DayTradingGuidance #TarotAndStockMarket #DayTrading #PatternTrading #SwingTrading #StockMarketPsychic #S&P